
Data flywheels
Generating Value from Data beyond Insights

This post is a more detailed version of my talk at Google Cloud Summit Nordics 2024 last week. A shoutout to my employer SYNQ for encouraging me to take part in talks and write posts like this one and supporting my passion for sharing insights with the broader data community.
How do you know if your analytical data creates value beyond data insights?
Christmas 2022, while managing the data platform team at Mathem (Swedish online grocery), I had volunteered to be on-call and early in the morning I woke up receiving an urgent message from our replenishment team. They were concerned that the purchase proposals generated by our system seemed off, and with the team already short-staffed due to the holidays and a hard deadline to send the purchase orders within 2 hours and doing that manually requires a lot of work, they were understandably stressed. The last thing we wanted was to run out of stock and disrupt customers' New Year's celebrations.
The purchase proposals were generated by a third-party vendor using machine learning on data exported from our analytical system. After some investigation, I discovered that one of the upstream pipelines had been failing, only providing half the data in time. As a result, none of our usual null or freshness tests had triggered any alerts and we didn’t have any volume anomaly monitors at that time (something we implemented shortly after). I had to identify affected downstream models and re-run them to resolve the problem. Although we sorted things out before the deadline this time, it was a stressful situation that no one wants to be in, especially with the stakes being high and the clock ticking.
This experience showed me that when analytical data feeds into operations, you know it's valuable beyond insights, because when things go wrong then people will reach out urgently and you will feel the impact immediately.
You know your data is valuable beyond insights when things go wrong, because people will reach out urgently and you will feel the impact immediately.
The Growing Role of Data in Organizations
Let’s start by discussing the data flywheel, a powerful concept that highlights the role data plays in creating continuous value.

In its simplest form, a data flywheel works like this: you begin with customers interacting with your products or services. Each interaction generates more data, which then flows into your analytical systems—systems that can process, analyze, and learn from this data. From that analysis, you gain insights and build better models—models that improve your products and services. This leads to product or process improvements that are fed back into your operational systems. The result? Your customers receive a better experience, which leads to more customers and hence more value. This completes the cycle, and with more customers, you now have even more data to improve upon.
The real power of the flywheel comes from completing the cycle. If the cycle breaks at any point—say, due to unreliable data or poor integration between systems—the value you could have generated gets lost. A half-complete flywheel means you aren’t capitalizing on the full potential of your data, and your efforts to improve products and customer experiences slow down.
What’s also important is the speed and scale of the flywheel. The faster you can complete a cycle—turning raw data into better models, which in turn improve operations—the more value you generate in a shorter period of time. It’s like a snowball: as you accumulate more data, the bigger the flywheel gets, and the more it can drive improvements across your business. It’s this compounding effect that makes data flywheels so valuable. But—this only happens if all parts of the cycle are reliable and connected.
Now, as we start to operationalize analytical data—feeding insights directly into systems that impact operations—the importance of data reliability becomes even greater. If the data feeding into your operational systems is unreliable, you risk making poor decisions that could negatively impact your customers and business processes.
The data flywheel isn’t just about collecting data; it’s about using that data to create continuous, compounding value for your organization. But the key to unlocking that value lies in completing the cycle, ensuring that your data is reliable and your systems are well-integrated.
Barriers to Effective Data Flywheels
Let’s talk about the challenges that prevent many organizations from building reliable and scalable data flywheels. A data flywheel needs to be connected and coordinated on multiple levels—both in terms of people and teams, as well as the underlying technology and systems. But even with the best intentions, these connections often break down, which stalls the entire process.
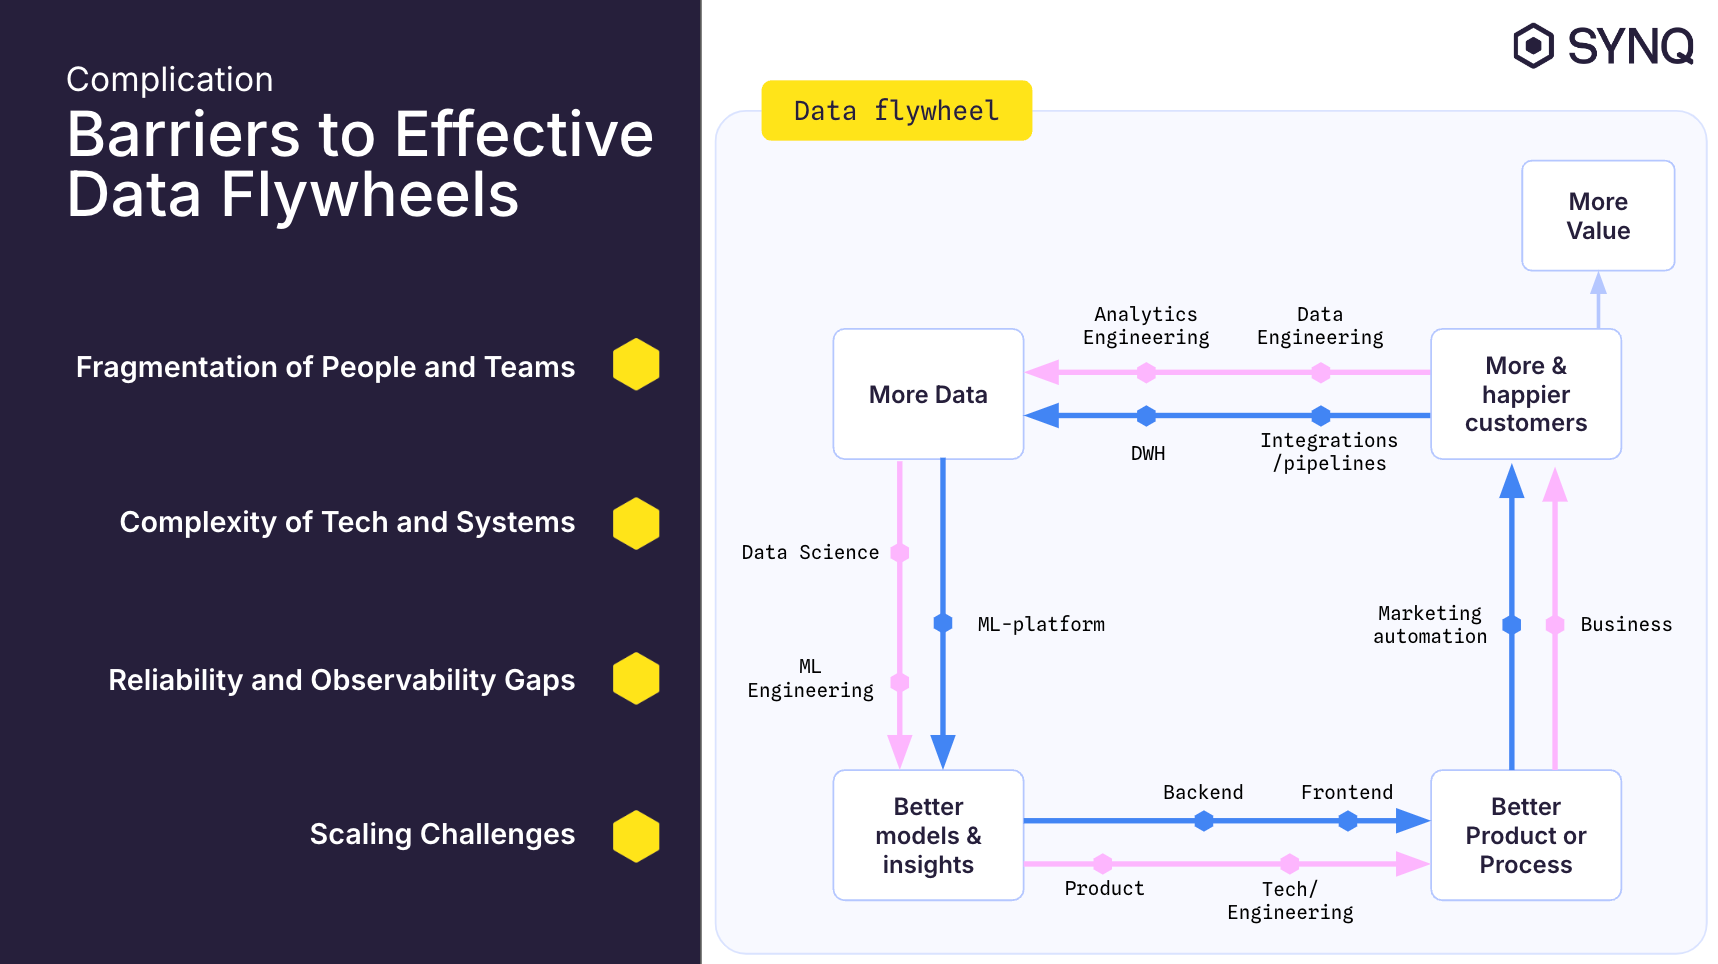
Fragmentation of People and Teams
First, let's talk about the human side. Data engineers, data analysts, business stakeholders, and other teams often work in silos. They might have different goals, processes, or definitions of what 'good' data looks like. Without proper communication and alignment, these teams end up working on different parts of the flywheel, leading to inefficiencies or even contradictions in how data is processed and used, they could even work on different flywheels not completing any of them.
Complexity of Technology and Systems
Then there’s the technical complexity. Organizations use multiple tools, platforms, and cloud services to manage their data. These systems don’t always integrate well with one another. You end up with pipelines that are disconnected, where data flows in different formats or doesn’t meet the same quality standards. This lack of consistency makes it harder to keep the flywheel moving at the speed you need.
Reliability and Observability Gaps
Even when everything looks good on paper, things can and will go wrong in practice. Maybe one of your data sources fails, or a pipeline slows down due to performance issues. If you don’t have the right observability in place—meaning, you can’t see these problems as they happen—the flywheel grinds to a halt. It’s like a broken link in a chain. One weak edge can impact everything downstream, causing missed insights, delayed decision-making, or even incorrect analysis.
Scaling Challenges
Finally, scaling. As your organization grows and your data volumes increase, the complexity of your architecture also grows. What worked at a smaller scale might break when you try to process 10x more data or onboard new teams. Without a proper plan for scalability, the flywheel becomes inefficient, and you can’t leverage the full value of your data as quickly as needed.
Whether it’s the fragmentation of people, the complexity of systems, or issues of reliability and scaling, the data flywheel can easily be disrupted by a single failure in the network. To avoid this, we need a robust framework that ensures each part of the flywheel—whether it’s team coordination or technical infrastructure—operates seamlessly together.
How Can We Build Faster, Reliable Data Flywheels?
To create faster and more reliable data flywheels, I’ve found three components very useful and working well together: data contracts, an opinionated unified data platform, and data observability. Let’s briefly walk through each before diving into details.

Data Contracts
First, data contracts. These are formal agreements that ensure everyone are aligned on what data will be delivered, in what format, and under what conditions. Data contracts prevent miscommunication between teams and ensure that the data entering your flywheel is reliable and ready for use. By establishing clear expectations upfront, data contracts reduce the risk of data quality issues that could slow down or break the flywheel.
Opinionated Unified Data Platform
Next is the opinionated unified data platform. This isn’t just any platform—it’s a system that enforces certain rules, standards, and best practices by design. This ‘opinionated’ approach enables automation and provides guardrails that reduce risks while speeding up operations. Because the platform comes with built-in standards, you don’t need to reinvent the wheel for every new project. It enables fast and scalable deployments by ensuring consistency across your data architecture. Automation within this platform takes care of repetitive tasks, reducing human error, and the guardrails ensure that all processes are compliant with best practices, even as your flywheel scales. This approach is critical for reducing complexity and ensuring the flywheel spins faster while minimizing risks.
Data Observability
Finally, data observability. This is the layer that monitors your data products. With observability, you can detect data quality issues or job failures before they become major problems. Data observability ensures the continuous health of your flywheel, allowing you to fix issues early, keep the process running smoothly, and ultimately maximize the value of your data.
To build faster, more reliable data flywheels, you need data contracts to guarantee data reliability, an opinionated unified data platform to ensure speed and scalability with built-in automation and guardrails, and data observability to monitor the health of your pipelines. Together, these components ensure that your flywheel operates at full speed and scales effectively.
Data Contracts – The Foundation for Reliability
Let’s talk about how data contracts (or declarative management if you like) serve as the foundation for reliability in our data flywheel. Data contracts not only prevent data quality issues, but they also establish clear ownership and enable automated workflows, ensuring that the data powering the flywheel is always accurate and fit for use.
Create data contracts
In the picture below you see an example of a data contract we used at Mathem. It’s defined using YAML, and this particular contract governs product proposals submitted by customers, which helped us complement the assortment of items we stock. As you can see, the contract defines the source and target—in this case, BigQuery tables—and includes the data models we wanted to generate in our silver layer. This was part of our medallion architecture and ensured data was ready for downstream consumers.

Each contract also clearly defines ownership, identifying the squad responsible for this data asset, as well as the repository where the service originates. This establishes a clear chain of responsibility, ensuring that teams know exactly who owns the data and where to find it.
To make the generation of data contracts easier, faster and consistent we even had a CLI to generate contracts from Data Transfer Objects (DTOs) in micro-services code. Small things like this that improve the stakeholder experience can make tremendous difference in adopting a platform, in this case reducing the burden of data producers to take on ownership.
Test and Review
Creating and publishing a data contract involves collaboration between data producers and data consumers. When a producer makes a pull request for a new or updated contract, a number of data consumer teams are notified to review it. This leads to discussions around data types, field requirements, and primary/sort keys, but it also involves talking about what models consumers need downstream.

Here you see a GitHub pull request where this collaboration happens, and it’s more than just conversation—there are also automated tests that validate the contract’s compliance with internal specifications and if sample data meets the contract’s criteria, ensuring everything works before the contract is accepted.
Merge to Automation
This diagram illustrates the full process. Once the contract is approved and merged, it automatically triggers the provisioning of data infrastructure and policies, the generation of dbt models, and deployment of an updated contract service.
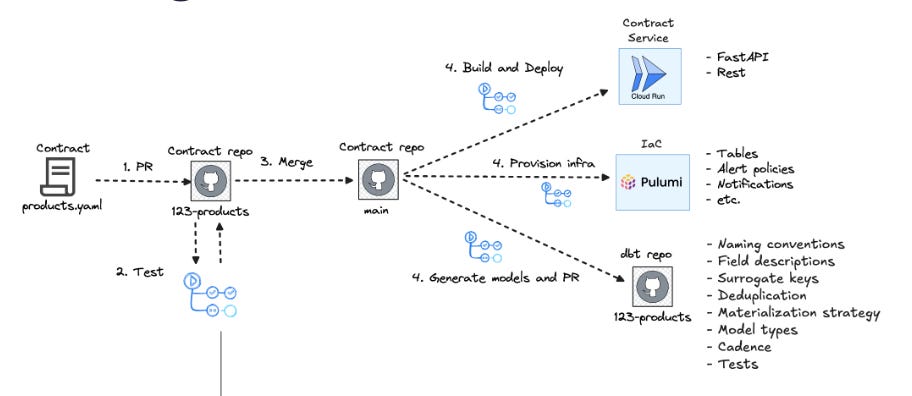
The generation of the first layer of dbt models takes care of most of the manual and repetitive modeling work that an analytics engineer otherwise would have to do for each added datastream, such as deduplication, naming conventions, frequency, surrogate keys, etc. This automation speeds up the process, reduces errors, and ensures reliability at every step. What happens is that the we programmatically created dbt models based on the data contract declarations and make a pull request to the dbt repository for analytics engineers to approve and merge which in turn would build and deploy the dbt service.
This means the entire process is automated—from creation to deployment—removing bottlenecks and allowing both data producers and data consumers to be aligned on the data’s structure, quality, and expectations without the need for manual intervention or involvement of a central data platform team.
Data contracts also play a crucial role in improving data quality across systems. At Mathem, many of our micro-services used schemaless storage layers, like DynamoDB. By using data contracts, we could validate data quality even at the operational level, ensuring that data feeding into our analytical system was clean and ready to use.
Data contracts not only help prevent data quality issues and establish ownership, but they are also the vehicle for communication, validation, and automation. This makes the entire data flywheel more efficient, ensuring that both data producers and data consumers are aligned on what’s needed to build valuable and reliable data products.
Unified Data Architecture - A Scalable Approach
To build a fast and reliable data flywheel, you need a unified data architecture that can handle both diverse input data sources and varied output use cases—all while maintaining a streamlined and scalable core.

Architecture Overview
This architecture diagram shows how we approached this at Mathem. On the left, you can see our five input data ports, each representing different integration patterns that we supported. These could range from batch uploads to streaming events, all feeding data into the same system.
In the middle, we had our unified core. Here, we’ve brought together a small, opinionated set of components that handle processing, ingestion, data contracts, transformation, monitoring and data warehousing. By using this unified core, we could simplify operations, reduce maintenance costs, and made it easier for our team to work across all parts of the platform, regardless of the data source or destination.
Ingestion and Processing
Our ingestion system was built on a streaming architecture, designed to handle high-speed data flows from events or Change Data Capture (CDC). But also batch mode extraction was transformed into streaming load, for example, when a file is uploaded to Google Cloud Storage (GCS), it triggered an event that invoked a Cloud Function. This function read the data and published it to a Pub/Sub topic for processing by Dataflow. This helped us avoid lambda architectures while solving for the lowest latency use case.
Since the processing was streaming and message based we only needed one processing job to manage all data streams (~100) as all messages carried a namespace attribute that with the help of corresponding data contract enabled fan out ingestion to the right tables in the data warehouse. This made the processing very cost efficient and combined with CDC it was cheaper (and more complete and granular) than snapshotting tables and do batch uploads of files.
The data contract service, also ensured that every piece of data entering the system met agreed-upon specifications, enabling reliable processing and transformation downstream.
Transformation and Data Contracts
Transformation was handled by a FastAPI application running on Cloud Run, which executed dbt models based on schedules defined in the data contracts. This process was also fully automated and integrated into a CI/CD pipeline, ensuring that each transformation is validated before it moves to production.
Data contracts drive the automation, ensuring that every transformation or process adheres to the contract, reducing the chance for human error and increasing reliability.
Output Ports for Use Cases
On the right side, you’ll see our three main output data ports: Data exports, Business Intelligence, and Machine Learning. Each of these represents a key use case for how the data was consumed. For example, the export system was event-driven and leveraged custom built dbt macros—when an export data model was ready, it triggered an event that handles exporting the data using GCS, Cloud Functions, and Workflows.
By having a unified approach to ingestion, transformation, and export, we enabled stakeholders to take ownership of their business logic and data quality. The platform provided the necessary systems and tooling, making it easier for them to build reliable data solutions without depending on a central team for every request.
Scalability and Speed
This architecture isn’t just scalable; it is also incredibly fast. Since the entire system is built on streaming, data is available for analysis within 2-5 seconds of reaching one of the input ports. This was crucial for certain low latency analytics use cases at Mathem, where high data freshness is essential.
Unified Yet Loosely Coupled
The beauty of this architecture is that while it’s unified, it’s also loosely coupled. Each component is independent but works together in a streamlined fashion, supporting both producers and consumers with well-defined patterns. This keeps the platform scalable, maintainable, and efficient.
The unified data architecture allows us to reduce complexity, enable scalability, and provide autonomy to teams, while ensuring that the entire data flywheel—from input to output—operates seamlessly.
Data Observability – Ensuring Trust and Visibility
In modern data-driven organizations, reliability and trust in your data are paramount. To achieve this, you should treat every data use case as a distinct, self-contained product. This approach helps ensure that every data flow—from source to output—is well-defined, owned, and continuously monitored.
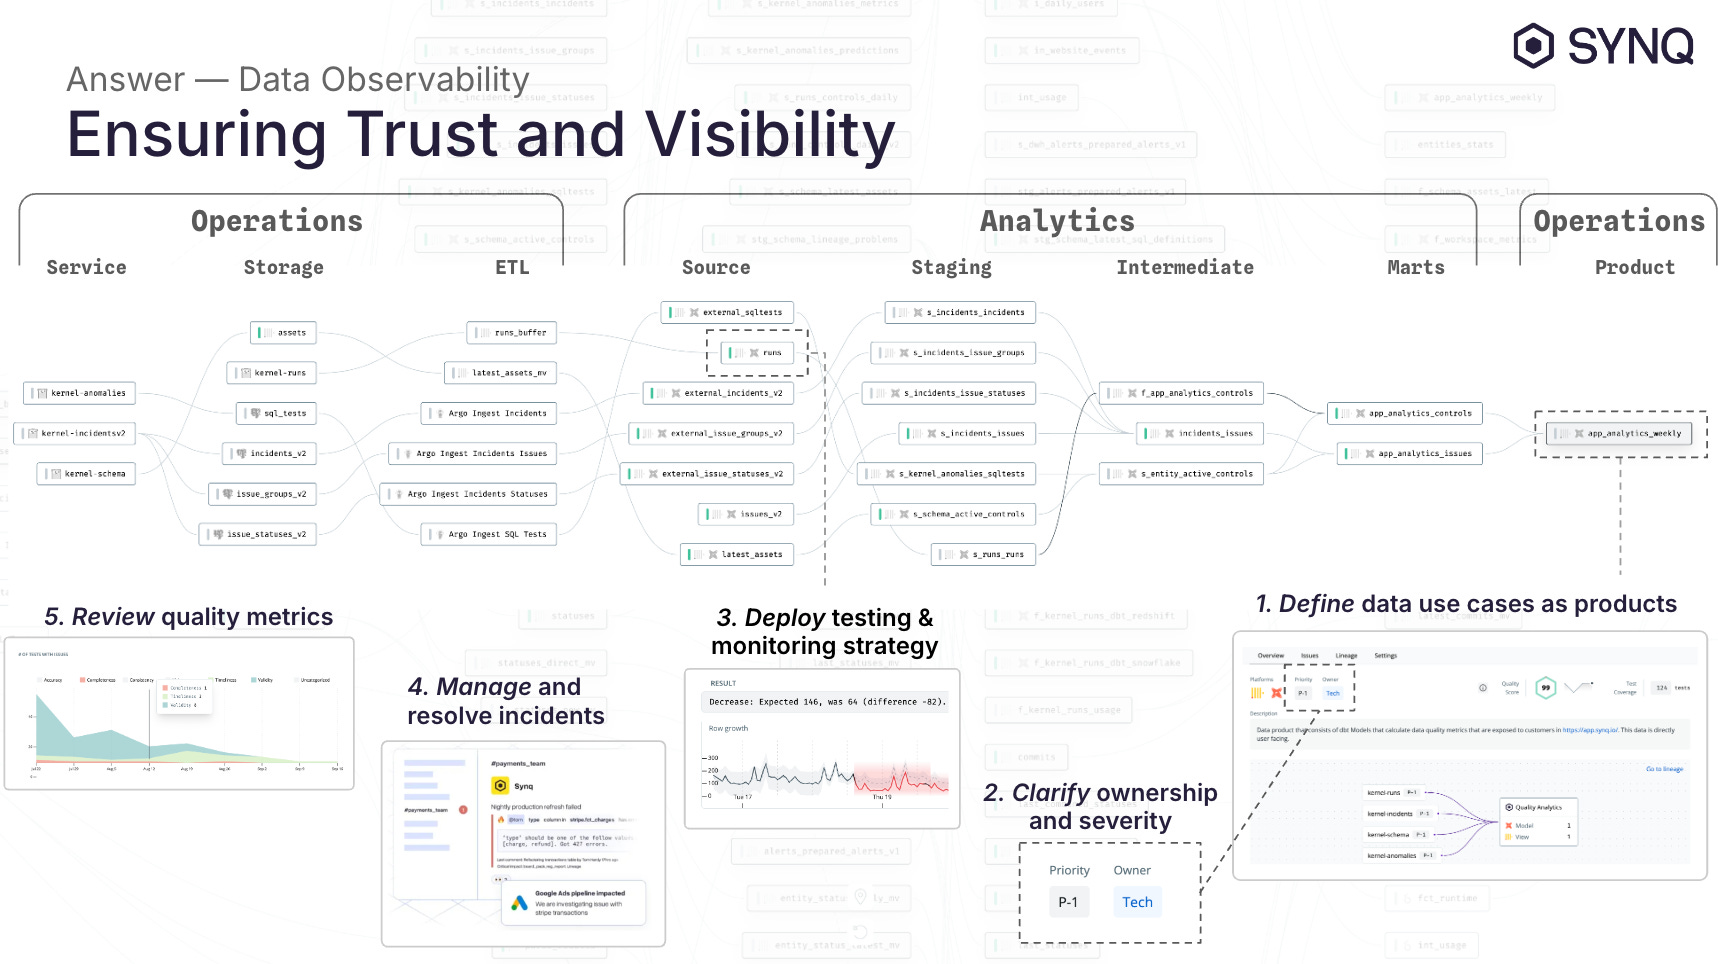
Define Data Use Cases as Data Products
The first step is to define your data use cases as data products. Whether it’s a BI report, a machine learning model, or an operational table, each use case should be treated as a product with clear boundaries, sources, and destinations.
In the picture you can see an example of a data lineage: data starts in operational micro-services, moves through ETL jobs, is processed by dbt models, and is finally consumed in operational tables. Each step represents a part of the data product.
Clarify Ownership and Severity
Next, you need to clarify ownership for each data product. Assigning clear ownership ensures that someone is always accountable for the product’s reliability. Equally important is linking incident severity to the product, so that any issues are automatically routed to the right person or team based on predefined severity levels.
This ensures that issues are handled swiftly and by the right stakeholders, preventing delays in the resolution process.
Deploy Testing and Monitoring Strategy
Once ownership is in place, the next step is to deploy a structured testing and monitoring strategy (download guide here). This doesn’t mean you should implement tests at every stage of the data pipeline but apply different sorts of tests where they make most use and value to ensure data integrity and quality. By proactively testing and monitoring, you can detect problems early and resolve them before they impact downstream systems or decisions.
Manage and Resolve Data Incidents
Even with the best preventive measures, incidents will happen. When they do, it’s crucial to have an efficient process for managing and resolving them. This means not only identifying the root cause but also communicating with all stakeholders—both upstream and downstream—about the issue and its resolution.
In this data lineage example, incidents could occur anywhere in the flow, from the source systems to the final operational tables. Having a clear line of sight across the entire data pipeline ensures faster resolution and minimizes business impact.
Review Data Quality Metrics
Finally, you need to continuously review data quality metrics for each data product. Regular monitoring ensures that you can spot recurring issues, identify trends, and take proactive measures to address potential risks before they escalate. By consistently reviewing these metrics, you ensure that the data product remains reliable and valuable over time, supporting your overall data flywheel.
By following the data product reliability workflow—defining data products, assigning ownership, deploying tests strategically, managing incidents, and reviewing metrics—you create a foundation of trust and reliability across your data pipelines. This ensures that your data remains accurate, actionable, and ready to fuel innovation and decision-making.
Real-Life Data Flywheel Example – Online Grocery Replenishment
Let’s bring everything together by circling back to the initial story and real-life example of a data flywheel: the online grocery replenishment system at Mathem. This example shows how data contracts, a unified data architecture, and data observability work together to ensure the flywheel operates efficiently, reliably, and at scale.
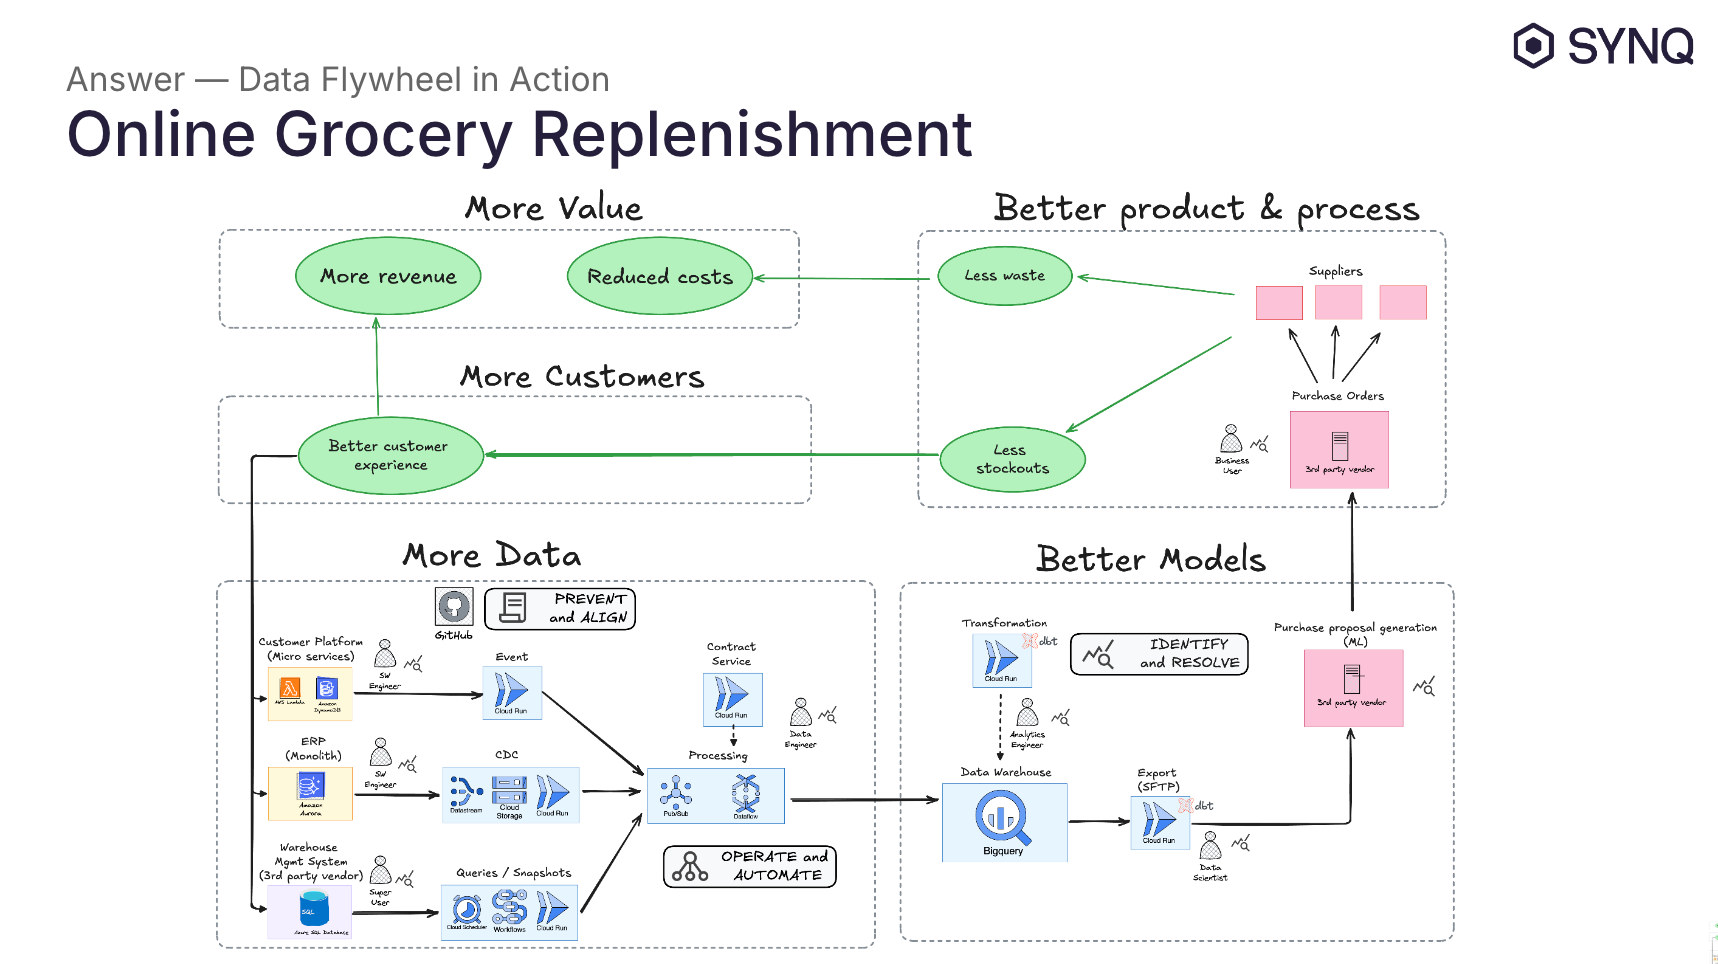
More Data
At the heart of the flywheel is the data generated by various operational systems—the e-commerce platform, ERP system, and warehouse management system. These systems generate events, CDC (Change Data Capture), and snapshots, which enter the data platform through input data ports.
Data Contracts: Data contracts applied at this stage prevent issues by aligning teams, systems, and processes. They define the structure, quality, and ownership of data, ensuring everyone is on the same page and reducing potential data quality problems.
Unified Data Architecture: The unified data architecture allows us to operate these systems reliably and automate key processes. This architecture ensures that as data volumes grow, we can scale operations without needing to constantly adjust manually or grow the data team proportionally, keeping operations efficient and automated.
Better Models
Once the data is processed in the data warehouse, it’s transformed using dbt models and exported to a third-party vendor that applies machine learning models to generate purchase proposals, helping predict demand and optimize stock levels.
Data Observability: At this stage, data observability plays a critical role in ensuring that the data feeding into these models is reliable. It monitors the health of data pipelines, helping us identify and resolve issues early. Observability ensures that the data transformations are accurate and that the machine learning models are fed with high-quality data. This minimizes downstream errors, ensures accurate demand predictions, and keeps stakeholders informed about any data quality issues.
Better Product
The replenishment system uses the machine learning-driven proposals to generate purchase orders that are sent to suppliers. The impact is significant:
Less spoilage/waste due to more accurate stock predictions. Every percentage reduced spoilage is profit.
Fewer stockouts, meaning customers consistently find the products they want, and get delivered what they’ve ordered, improving their experience.
More Customers
By keeping products available and minimizing stockouts, we create a better customer experience, which drives repeat purchases and attracts more customers.
More Value
This flywheel generates value by:
Increasing revenue from more customers due to better availability and a smoother shopping experience.
Reducing costs through improved stock management, lowering spoilage and waste.
As more customers come into the system, more data is generated, feeding back into the operational systems and completing the flywheel.
Autonomy and Scalability
One of the major benefits of the unified data architecture is that it empowers stakeholders across the flywheel to be more autonomous. Teams can take ownership of their parts of the process—whether it's operations, machine learning, or replenishment management—without relying on constant oversight from the data team. This autonomy is key for scaling the system without proportionally scaling the data team.
This real-life example of a data flywheel demonstrates how data contracts, a unified data architecture, and data observability come together to drive value. With reliable data, better models, and improved customer experience, we generate more revenue and reduce costs, while ensuring the flywheel scales efficiently and continuously delivers value. It is a great example of how to generate real business value from data beyond insights.
Transforming Data Operations: Platform vs Pipelines Uplift
Switching to a unified data platform with data contracts brought a major uplift in both efficiency and adoption. Let’s look at the key metrics that highlight the difference between our old pipeline system and the new platform.

Data Streams and Processing Jobs
In just 7 months of using the new platform, we managed to onboard 90 data streams, compared to 45 over the course of 50 months with the old system. Even more impressive, we’re now running just one processing job, down from 45. This huge reduction in jobs cuts down on maintenance and operational overhead, while significantly improving resource utilization.
Cost Savings
The new platform also brings cost efficiency. With the pipelines, we were paying $0.30 per GB, but under the unified platform, we’ve reduced that to just $0.06 per GB. This represents a dramatic improvement in cost-effectiveness while scaling up data operations.
Adoption and Engagement
One of the most positive aspects of the switch has been the adoption by both data producers and consumers. We’ve doubled the number of committers—people actively adding data sources—and the overall activity has increased 10x. Monthly commits jumped from 14 to 130, showing just how much more engaging and efficient the new process is.
Onboarding New Data Sources
Onboarding has become incredibly fast. We used to average one new data stream per month, but with the new platform, we’re now onboarding one stream every second workday, averaging 13 per month. This shows how streamlined the process has become.
While these numbers reflect the success of the new platform, they also tell a bigger story: a poor solution can drastically slow down adoption.
You’ll never reach that flywheel self-sustaining momentum unless stakeholders have a great experience and efficient process. With this new platform, we’re seeing both faster adoption and a more scalable, cost-effective system that empowers teams to act quickly.
Key takeaways
Let’s summarize this long post in a four key takeaways.

Focus on completing the data flywheel
The first key takeaway is that the data flywheel needs to be completed to generate continuous value. It's not enough to optimize individual parts of the flywheel—teams need to align across the entire cycle to ensure smooth, continuous feedback loops that improve products and processes. Half-built or disconnected flywheels leave value on the table.
Adopt data contracts to prevent data issues
Second, data contracts are essential. They don’t just prevent data quality issues; they establish clear ownership, alignment between teams, and automate parts of your data infrastructure. Data contracts ensure that everyone knows what data is expected, who is responsible for it, and how it’s being used.
Leverage a unified data platform for scalability and speed
A unified data platform is critical for scaling and speeding up operations. With built-in automation and guardrails, this opinionated architecture ensures fast deployments and reliable operations, so your data flywheels runs efficiently even as data volume and the number of flywheels grows.
Utilize data observability to resolve the unexpected
Finally, data observability ensures you can address the unknowns. While data contracts prevent issues you’re aware of, observability helps you monitor the entire flywheel, detecting and resolving incidents before they become serious problems. It’s how you maintain the health of your data flywheel.
Let’s rethink data reliability and value creation
I’d love to hear your thoughts or questions on this topic—feel free to drop a comment below and share your perspective. Whether you're navigating similar challenges or have unique insights, I’m always eager to learn from the community.
If you'd like to dive deeper into this subject or discuss how I could present at your company’s internal conference, event, or workshop, don’t hesitate to reach out. You can contact me directly on LinkedIn for a chat or to explore how we could collaborate.
Looking forward to hearing from you!
I'm committed to keeping this content free and accessible for everyone interested in data platform engineering. If you find this post valuable, the most helpful way you can support this effort is by giving it a like, leaving a comment, or sharing it with others via a restack or recommendation. It truly helps spread the word and encourage future content!
Great article! How did you handle data contracts for third-party data sources like Salesforce, Stripe, Google Analytics etc? Also, was there a single instance of a Dataflow job handling all sources, or were separate Dataflow jobs initiated based on source type, source, target, etc.?